Multiple Choice
Construct a pie chart representing the given data set.
-The following data give the distribution of the types of houses in a town containing 34,000 houses.

A) 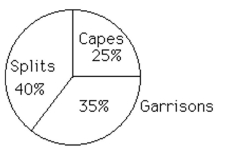
B) 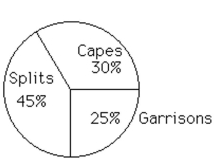
Correct Answer:

Verified
Correct Answer:
Verified
Related Questions
Q71: Provide an appropriate response.<br>-Suppose that a
Q72: A television manufacturer sold three times as
Q73: The following data represent the total
Q74: The graph below shows estimated world
Q75: Provide an appropriate response.<br>-Suppose that you
Q77: Solve the problem.<br>-The attendance counts for
Q78: Make a bar graph to represent
Q79: Construct a line chart for the
Q80: Construct the requested histogram.<br>-Lake County wanted
Q81: Solve the problem.<br>-The midterm test scores