Multiple Choice
Provide the appropriate response.
-The following dot plot represents the ages of the people in a sample selected from a group of campaign
Volunteers. 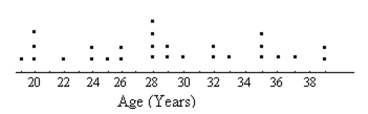
How many people were in the sample?
A) 21
B) 28
C) 30
D) 27
Correct Answer:

Verified
Correct Answer:
Verified
Related Questions
Q8: A nurse measured the blood pressure of
Q9: Provide the appropriate response.<br>-Attendance records at
Q10: Answer the question using the graphical display.
Q11: Provide an appropriate response.<br>-Suppose that you
Q12: A medical research team studied the
Q14: A machine is supposed to fill
Q15: Construct a line chart for the
Q16: Construct a pie chart representing the
Q17: Provide an appropriate response.<br>-A professional tennis
Q18: Construct the requested table. Round relative