Multiple Choice
Use the graph to answer the question.
-This double-bar graph shows the number of male (M) and female (F) athletes at a university over a four-year Period. 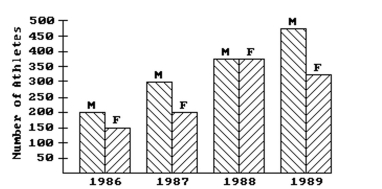
Compare the trend in the number of male athletes during the four-year period and the trend in the number of Female athletes during the four-year period .
A) The number of male athletes increased steadily over the four-year period. The number of female athletes increased in 1987 then decreased again in 1988 and 1989.
B) The number of male athletes and the number of female athletes increased steadily over the four-year period.
C) The number of female athletes increased steadily over the four-year period. The number of male athletes increased to a peak in 1988 and then decreased again in 1989.
D) The number of male athletes increased steadily over the four-year period. The number of female athletes increased to a peak in 1988 and then decreased again in 1989.
Correct Answer:

Verified
Correct Answer:
Verified
Q91: Construct the requested table. Round relative
Q92: Create a graphical display for the
Q93: Construct the requested histogram.<br>-A medical research
Q94: Answer the question using the graphical display.
Q95: Answer the question using the graphical display.
Q97: The following data show the body
Q98: Provide an appropriate response.<br>-Shortly before an
Q99: Create a graphical display for the
Q100: Provide an appropriate response.<br>-A car insurance
Q101: A teacher asked each of her