Multiple Choice
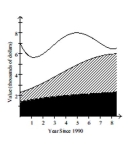
The stacked line chart shows the value of each of Danny's investments. The stacked line chart contains three regions. The uppermost unshaded region represents the value of Danny's investment in individual stocks. The center shaded region represents the value of Danny's investment in mutual funds and the bottom region in black represents the value of Danny's investment in a CD. The thickness of a region at a particular time tells you its value at that time.  Use the graph to answer the question.
-In the year 1998, approximately what percentage of Danny's total investment was in mutual funds?
A) 80%
B) 70%
C) 50%
D) 60%
Correct Answer:

Verified
Correct Answer:
Verified
Q15: Solve the problem.<br>-Suppose that you construct a
Q105: Construct a line chart for the
Q106: Andrew creates a bar graph to
Q107: Solve the problem.<br>-Twenty-four workers were surveyed
Q108: Construct the requested histogram.<br>-The following frequency
Q109: The stem-and-leaf diagram below shows the
Q111: Solve the problem.<br>-Wagenlucht Ice Cream Company is
Q112: The stacked line chart shows the value
Q114: Provide an appropriate response.<br>-The frequency table
Q115: Solve the problem.<br>-The Kappa Iota Sigma Fraternity