Multiple Choice
Provide an appropriate response.
-The following graph represents a function. Identify the independent and dependent variables and describe the domain and range. 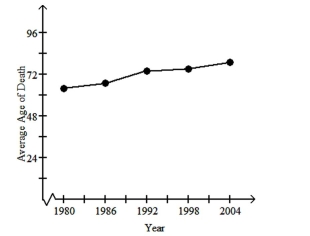
A) The independent variable is age and the dependent variable is time, measured in years. The domain is the ages between 0 and 79. The range is the years between 1980 and 2004.
B) The independent variable is time, measured in years, and the dependent variable is age. The domain is the years between 1980 and 2004. The range is the ages between 0 and 79.
C) The independent variable is age and the dependent variable is time, measured in years. The domain is the years between 1980 and 2004. The range is the ages between 0 and 79.
D) The independent variable is time, measured in years, and the dependent variable is age. The domain is the ages between 0 and 79. The range is the years between 1980 and 2004.
Correct Answer:

Verified
Correct Answer:
Verified
Q47: Briefly discuss the conditions under which a
Q48: Plot and label the given points.<br>-
Q49: Plot and label the given points.<br>-
Q50: Provide an appropriate response.<br>- <span class="ql-formula"
Q51: The population of a town with
Q53: Write a short statement that expresses a
Q54: Write an equation for the linear
Q55: What is comprised of the values of
Q56: Briefly discuss the conditions under which a
Q57: Briefly discuss the conditions under which a