Multiple Choice
Provide an appropriate response.
-The following graph represents a function. Describe the function in words. 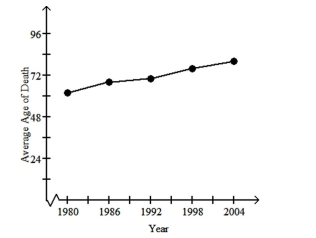
A) The function shows a steadily increasing average age of death between 1980 and 2004.
B) The function shows a steadily decreasing average age of death between 1980 and 2004.
C) The function shows that the average age of death increases between 1980 and 1992 and does not change between 1992 and 2004.
D) The function shows that the average age of death per year does not change between 1980 and 2004.
Correct Answer:

Verified
Correct Answer:
Verified
Q40: Solve the equation for the unknown
Q41: A linear function has a varying rate
Q42: The given situation involves a rate of
Q43: A certain drug is eliminated from the
Q44: Provide an appropriate response.<br>-A toxic radioactive substance
Q46: Create the required linear function an
Q47: Briefly discuss the conditions under which a
Q48: Plot and label the given points.<br>-
Q49: Plot and label the given points.<br>-
Q50: Provide an appropriate response.<br>- <span class="ql-formula"