Multiple Choice
Provide an appropriate response.
-The following table gives the birth and death rates for four countries in three different years: 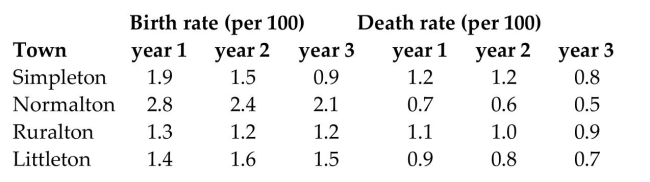 Find Littleton's net growth rate due to births and deaths in year 1.
A) 0.6 per 100
B) 0.9 per 100
C) 0.4 per 100
D) 0.5 per 100
Correct Answer:

Verified
Correct Answer:
Verified
Q18: Provide an appropriate response.<br>-Birth rates have increased
Q19: Use the earthquake magnitude scale to
Q20: Provide an appropriate response.<br>-In 2000, the population
Q21: Provide an appropriate response.<br>-Which of the following
Q22: Provide an appropriate response.<br>-The Consumer Price Index
Q24: Provide an appropriate response.<br>-The carrying capacity of
Q25: Provide an appropriate response.<br>-Given that
Q26: Provide an appropriate response.<br>-Our town is growing
Q27: Provide an appropriate response.<br>-Suppose you had a
Q28: Provide an appropriate response.<br>-Earthquakes usually cause damage