Multiple Choice
Construct a boxplot as requested.
-The normal monthly precipitation (in inches) for August is listed for 20 different U.S. cities. Construct a boxplot for the data set.
A) 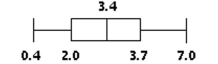
B) 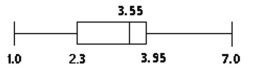
C) 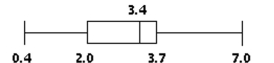
D) 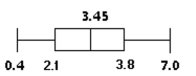
Correct Answer:

Verified
Correct Answer:
Verified
Related Questions
Q49: Find the mode(s)for the given sample
Q50: Use the 68-95-99.7 rule to solve
Q51: The result of a hypothesis is described
Q53: Find the standard deviation for the
Q55: Find the standard deviation for the
Q56: Construct a boxplot as requested.<br>-The highest
Q57: State which type of average, the mean,
Q58: Solve the problem.<br>-The local Tupperware dealers
Q59: Dave is a college student contemplating a
Q59: Provide an appropriate response.<br>-You are the coach