Multiple Choice
The graph below shows the approximate annual percentage growth rate in world population for the years 1960 through
2010. Data is estimated by the UN Census Bureau. 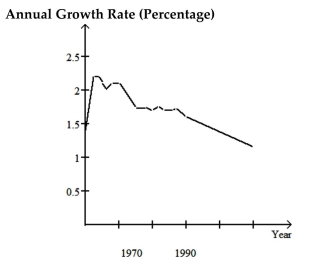 Use the graph to answer the question.
-In which year(s) , if any, during the period 1960-2010 is world population constant?
A) None
B) 1962-1964
C) 1962-1964, 1969-1971, 1975-1980
D) 1969-1971
Correct Answer:

Verified
Correct Answer:
Verified
Q79: Use the guidelines to evaluate the study.
Q80: A statement is made about correlation. State
Q81: Answer as requested.<br>-Which of the following pairs
Q82: Answer the question.<br>-What name is given to
Q83: Describe how you would apply the five
Q85: Answer the question.<br>-Which of the following study
Q86: Solve the problem.<br>-A researcher finds a positive
Q87: The graph below shows the approximate annual
Q88: Create a graphical display for the
Q89: State whether you think that the variables