Multiple Choice
The graph below shows estimated world population for the period 4000 BC =2000 AD. Note that the logarithm of the world population and not actual population is plotted on the vertical axis. This means, for example, that when the graph reaches 7 on the vertical scale, world population is and when the graph reaches 9 on the vertical scale, worldpopulation is .
Log World Population 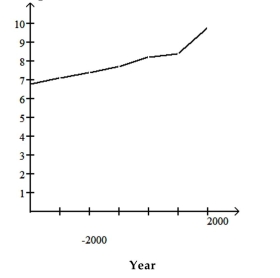 Use the graph to answer the question.
-Describe the general trend in world population during the period 2000 BC to the year 1 AD.
A) World population increases at a slower and slower rate.
B) World population increases at a constant rate.
C) World population is constant.
D) World population increases at a faster and faster rate.
Correct Answer:

Verified
Correct Answer:
Verified
Q151: Use the guidelines to evaluate the study.
Q152: Use the graph to answer the question.<br>-<img
Q153: Answer the question.<br>-In a study to determine
Q154: Provide an appropriate response.<br>-Suppose that a
Q155: Construct a pie chart representing the
Q157: A statement is made about correlation. State
Q158: Use the guidelines to evaluate the study.
Q159: Construct a line chart for the
Q160: Answer as requested.<br>-In studying the relationship between
Q161: Solve the problem.<br>-For the study described below,