Essay
Answer the question.
-The bar graph below shows the number of car accidents occurring in one city in each of the
years 1993 through 1998. The number of accidents dropped in 1995 after a new speed limit
was imposed. Why is the graph misleading? How would you redesign the graph so that it
is less misleading? What impression is conveyed by the graph? 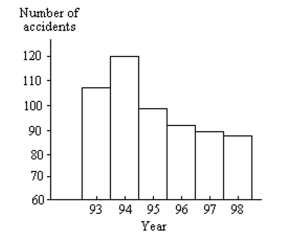
Correct Answer:

Verified
The graph is misleading because it is tr...View Answer
Unlock this answer now
Get Access to more Verified Answers free of charge
Correct Answer:
Verified
View Answer
Unlock this answer now
Get Access to more Verified Answers free of charge
Q145: Identify which of these types of sampling
Q146: Use the guidelines to evaluate the study.
Q147: Identify the variable as either qualitative
Q148: Answer the question.<br>-A television manufacturer sold three
Q149: A statement is made about correlation. State
Q151: Use the guidelines to evaluate the study.
Q152: Use the graph to answer the question.<br>-<img
Q153: Answer the question.<br>-In a study to determine
Q154: Provide an appropriate response.<br>-Suppose that a
Q155: Construct a pie chart representing the