Essay
Use the graph to answer the question.
-The time series line chart below shows the price of a volatile stock from January to
December of the same year. Describe the overall trend in the price during that period. 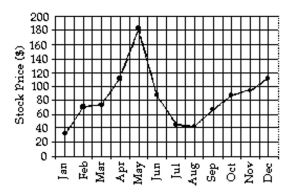
Correct Answer:

Verified
The price rose sharply from January to F...View Answer
Unlock this answer now
Get Access to more Verified Answers free of charge
Correct Answer:
Verified
View Answer
Unlock this answer now
Get Access to more Verified Answers free of charge
Q101: Answer the question.<br>-Which of the following quantities
Q102: In order to answer the given question,
Q103: State whether the scatter diagram shows strong
Q104: Answer the question.<br>-The mayor of one city
Q105: Construct the specified histogram.<br>-30 police detectives
Q107: Construct the specified histogram.<br>-24 high school
Q108: Use the guidelines to evaluate the study.
Q109: Provide an appropriate response.<br>-Consider the frequency
Q110: Construct a pie chart representing the
Q111: Make a bar graph to represent