Multiple Choice
The stack plot below shows the value of each of Danny's investments. The stack plot contains three regions. Theuppermost unshaded region represents the value of Danny's investment in individual stocks. The center shaded regionrepresents the value of Danny's investment in mutual funds and the bottom region in black represents the value ofDanny's investment in a CD. The thickness of a region at a particular time tells you its value at that time. 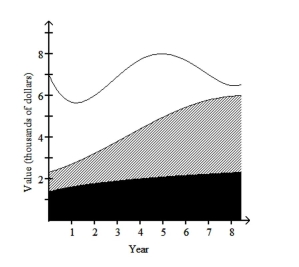 Use the graph to answer the question.
-In which year was the value of Danny's investment in individual stocks the least?
A) year 1
B) year 8
C) year 7
D) year 0
Correct Answer:

Verified
Correct Answer:
Verified
Q203: Provide an appropriate response.<br>-Suppose that you
Q204: Choose the best wording for the question
Q205: State whether you think that the variables
Q206: Create a graphical display for the
Q207: Construct a pie chart representing the
Q209: A sample statistic and margin of error
Q210: A statement is made about correlation. State
Q211: Answer the question.<br>-The strengths of the last
Q212: A sample statistic and margin of error
Q213: Solve the problem.<br>-A researcher suspects that pesticides