Multiple Choice
A hypothesis test for a population mean is to be performed. The hypotheses are
Which of the sketches below could represent the power curve for the test?
A) 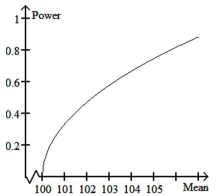
B) 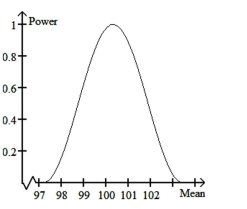
C) 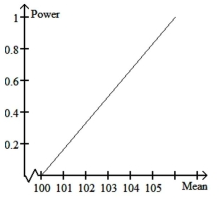
D) 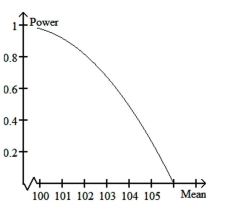
Correct Answer:

Verified
Correct Answer:
Verified
Related Questions
Q20: Traditionally in hypothesis testing the null hypothesis
Q21: Preliminary data analyses indicate that it
Q22: Provide an appropriate response.<br>-Suppose that you want
Q23: A high school biology student wishes
Q24: In 1995, the mean math SAT
Q26: Provide an appropriate response.<br>-A pharmaceutical company
Q27: Perform a one-sample z-test for a
Q28: A hypothesis testing situation is given.
Q29: Construct a graph portraying the decision
Q30: Preliminary data analyses indicate that it