Essay
Two graphical displays are given for a set of data. A hypothesis test is to be performed for the mean of the populationfrom which the data were obtained. Would it be reasonable to use a one-mean z-test? Explain your reasoning. Assumethat the population standard deviation is known.
-A normal probability plot and a stem-and-leaf diagram of the data are given below. 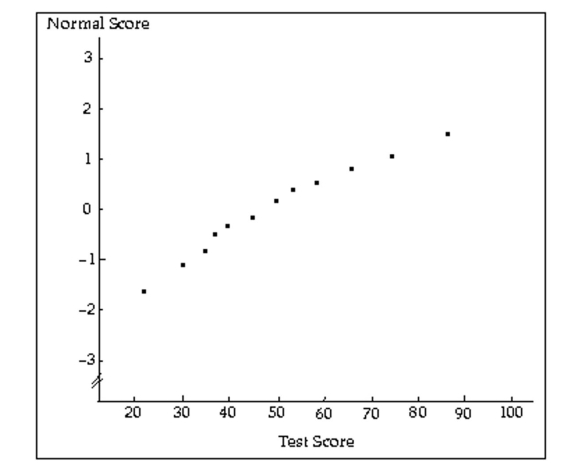
Correct Answer:

Verified
Yes; even though the sample size is smal...View Answer
Unlock this answer now
Get Access to more Verified Answers free of charge
Correct Answer:
Verified
View Answer
Unlock this answer now
Get Access to more Verified Answers free of charge
Q5: Preliminary data analyses indicate that it
Q6: Construct a graph portraying the decision
Q7: A hypothesis test for a population mean
Q8: Suppose that you wish to use a
Q9: A hypothesis test for a population
Q11: Outline the six steps involved in performing
Q12: Perform a one-sample z-test for a
Q13: Provide an appropriate response.<br>-Give an example
Q14: Preliminary data analyses indicate that it
Q15: Construct a graph portraying the decision criterion