Essay
Two graphical displays are given for a set of data. A hypothesis test is to be performed for the mean of the populationfrom which the data were obtained. Would it be reasonable to use a one-mean z-test? Explain your reasoning. Assumethat the population standard deviation is known.
-A normal probability plot and a stem-and-leaf diagram of the data are given below. 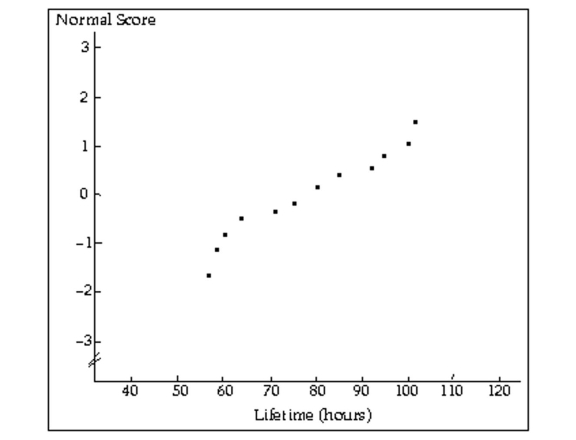
Correct Answer:

Verified
No; it would not be reasonable to use a ...View Answer
Unlock this answer now
Get Access to more Verified Answers free of charge
Correct Answer:
Verified
View Answer
Unlock this answer now
Get Access to more Verified Answers free of charge
Q35: Provide an appropriate response.<br>-A man is
Q36: Provide an appropriate response.<br>-Suppose that you wish
Q37: Construct a graph portraying the decision criterion
Q38: A hypothesis test for a population
Q39: Provide an appropriate response.<br>-Suppose that you want
Q41: Solve the problem. Use the critical-value
Q42: Construct a graph portraying the decision
Q44: Preliminary data analyses indicate that it is
Q45: Provide an appropriate response.<br>-Describe parametric and nonparametric
Q45: Two graphical displays are given for a