Multiple Choice
Find the requested probability.
-The test scores of 5 students are under consideration. The following is the dotplot for the sampling distribution of the sample mean for samples of size 2. 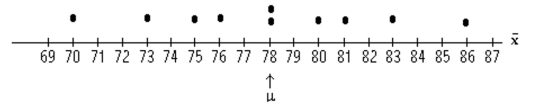
Find the probability, expressed as a percent, that the sample mean will be within 1 point of the population mean.
A)
B)
C)
D)
Correct Answer:

Verified
Correct Answer:
Verified
Q40: Solve the problem.<br>-The weights of five
Q41: For samples of the specified size
Q42: The mean annual income for adult
Q43: <span class="ql-formula" data-value="\text { Use the given
Q44: For samples of the specified size
Q46: Provide an appropriate response.<br>-As a general rule,
Q47: Find the indicated probability or percentage for
Q48: For the population of one town,
Q49: Find the indicated probability or percentage for
Q50: Draw the specified dotplot.<br>-The heights (in