Multiple Choice
Find the requested probability.
-The test scores of 5 students are under consideration. The following is the dotplot for the sampling distribution of the sample mean for samples of size 2. 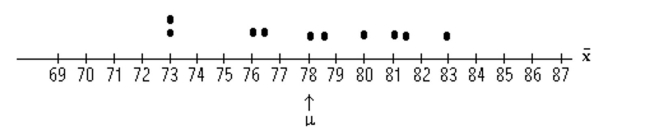 Find the probability, expressed as a percent, that the sample mean will be within 1 point of the
Population mean.
A) 10%
B) 30%
C) 20%
D) 25%
Correct Answer:

Verified
Correct Answer:
Verified
Q19: SAT verbal scores are normally distributed with
Q20: Find the indicated probability or percentage for
Q21: For samples of the specified size
Q22: Find the requested probability.<br>-The test scores of
Q23: Solve the problem.<br>-The weights of five
Q25: For samples of the specified size
Q26: Draw the specified dotplot.<br>-The heights (in
Q27: Find the indicated probability or percentage for
Q28: Do you agree with Tony's reasoning below?
Q29: Find the indicated probability or percentage for