Multiple Choice
Find the requested probability.
-The test scores of 5 students are under consideration. The following is the dotplot for the sampling distribution of the sample mean for samples of size 2. 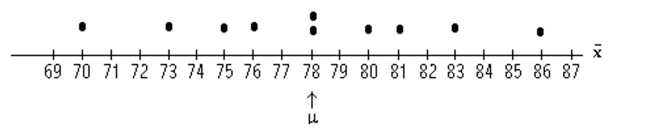 Find the probability, expressed as a percent, that the sample mean will be within 3 points of the
Population mean.
A) 50%
B) 60%
C) 70%
D) 40%
Correct Answer:

Verified
Correct Answer:
Verified
Q4: Provide an appropriate response.<br>-The mean height for
Q5: For the population of one town,
Q6: Provide an appropriate response.<br>-The mean height for
Q7: Provide an appropriate response.<br>-What generally happens to
Q8: Provide an appropriate response.<br>-The mean height
Q10: Solve the problem.<br>-The ages of six
Q11: The ages of six members of
Q12: Population data: 3, 4, 5, 6,
Q13: Provide an appropriate response.<br>-The mean height
Q14: Identify the distribution of the sample