Multiple Choice
Find the requested probability.
-The test scores of 5 students are under consideration. The following is the dotplot for the sampling distribution of the sample mean for samples of size 2. 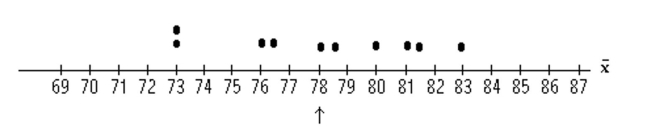 Find the probability, expressed as a percent, that the sample mean will be within 3 points of the Population mean.
A) 72%
B) 50%
C) 60%
D) 40%
Correct Answer:

Verified
Correct Answer:
Verified
Q29: Find the indicated probability or percentage for
Q30: Identify the distribution of the sample
Q31: Solve the problem.<br>-The ages of six
Q32: The heights of adult women in
Q33: Provide an appropriate response.<br>-Suppose that µ
Q35: Identify the distribution of the sample
Q36: Find the requested probability.<br>-The test scores of
Q37: Provide an appropriate response.<br>-How many different samples
Q38: Find the indicated probability or percentage for
Q39: Find the requested probability.<br>-The table reports