Essay
A normal probability plot is given below for a sample of scores on an aptitude test. Use the plot to identify outliers, if any. Explain your reasoning. 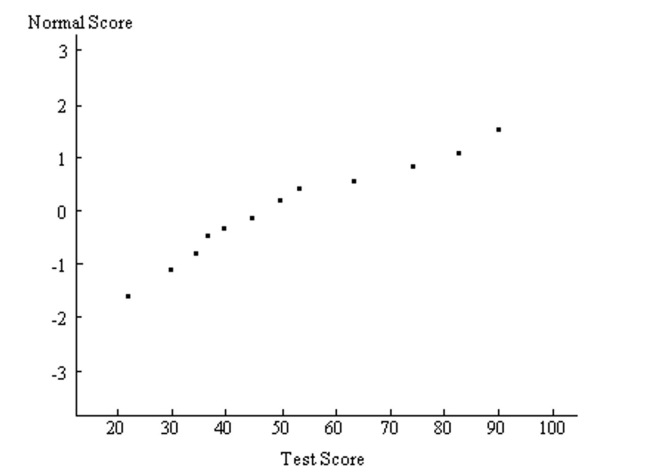
Correct Answer:

Verified
Since there are no p...View Answer
Unlock this answer now
Get Access to more Verified Answers free of charge
Correct Answer:
Verified
Since there are no p...
View Answer
Unlock this answer now
Get Access to more Verified Answers free of charge
Related Questions
Q53: Use a table of areas to
Q54: Find the specified percentile, quartile, or decile.<br>-The
Q55: Solve the problem.<br>-A northeastern college has
Q56: Fill in the blanks by standardizing the
Q57: Provide an appropriate response.<br>-A variable is
Q59: Estimate the indicated probability by using the
Q60: Solve the problem.<br>-Frequency data were reported
Q61: Use a table of areas to
Q62: The area under the standard normal curve
Q63: Which is larger, the area under the