Essay
A normal probability plot is given below for the lifetimes (in hours)of batteries of a particular type. Use the plot to identify outliers, if any. Explain your reasoning. 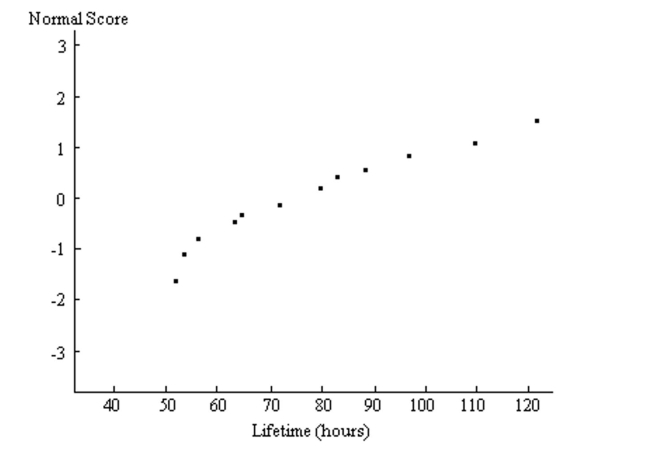
Correct Answer:

Verified
Since there are no p...View Answer
Unlock this answer now
Get Access to more Verified Answers free of charge
Correct Answer:
Verified
Since there are no p...
View Answer
Unlock this answer now
Get Access to more Verified Answers free of charge
Related Questions
Q26: Find the specified percentile, quartile, or decile.<br>-Assume
Q27: In assessing the normality of data, why
Q28: Use the empirical rule to solve the
Q29: Use the empirical rule to solve the
Q30: Sketch a standard normal curve and shade
Q32: Use a table of areas for the
Q33: Use a table of areas to find
Q34: Find the indicated probability or percentage for
Q35: Solve the problem.<br>-Data were reported for
Q36: Find the indicated probability or percentage