Multiple Choice
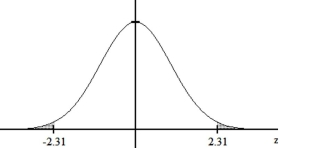
Use a table of areas to obtain the shaded area under the standard normal curve.
-
A)
B)
C)
D)
Correct Answer:

Verified
Correct Answer:
Verified
Related Questions
Q6: A normal probability plot is given below
Q7: Suppose that you know the area under
Q8: Frequency data were reported for the
Q9: Find the specified percentile, quartile, or decile.<br>-The
Q10: Find the specified percentile, quartile, or decile.<br>-A
Q12: Construct a normal probability plot of
Q13: The mean of a normally distributed variable
Q14: A student wished to use a table
Q15: Find the indicated probability or percentage for
Q16: Use a sketch of the standard normal