Multiple Choice
Construct the requested histogram.
-Each person from a group of recently graduated math majors revealed the number of job offers that he or she had received prior to graduation. The compiled data are represented in the table.
Construct the probability histogram for the number of job offers received by a graduate randomly
Selected from this group. 
A) 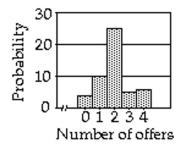
B) 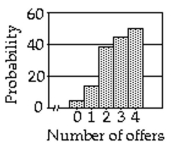
C) 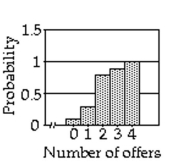
D) 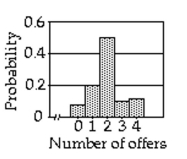
Correct Answer:

Verified
Correct Answer:
Verified
Q23: Provide an appropriate response.<br>-Suppose a mathematician computed
Q87: Evaluate the expression.<br>- <span class="ql-formula" data-value="\frac
Q88: Use random-variable notation to represent the
Q89: Which of the following describes the possible
Q90: Find the indicated probability. Round to four
Q91: Determine the required probability by using the
Q93: Calculate the specified probability<br>-Suppose that
Q94: Find the specified probability.<br>-Use the special
Q95: A Poisson random variable has an infinite
Q97: A coin is biased so that