Essay
The following contingency table provides a joint frequency distribution for the popular votes cast in the presidential election by region and political party. Data are in thousands, rounded to the nearest thousand. 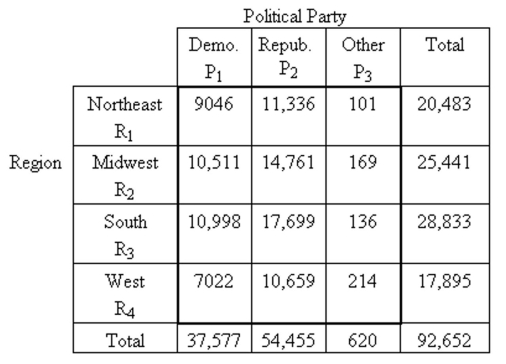 If a person who voted in the presidential election is selected at random, . Interpret this probability in terms of percentages.
Correct Answer:

Verified
28.0% of the people ...View Answer
Unlock this answer now
Get Access to more Verified Answers free of charge
Correct Answer:
Verified
View Answer
Unlock this answer now
Get Access to more Verified Answers free of charge
Q93: Determine the number of outcomes that comprise
Q94: List the outcomes comprising the specified
Q95: Find the indicated probability.<br>-A bag contains
Q96: Find the indicated probability by using
Q97: Provide an appropriate response.<br>-A contingency table
Q99: Find the indicated probability.<br>-The following contingency
Q100: Determine whether the events are mutually
Q101: Construct a Venn diagram representing the
Q102: Draw a Venn diagram and shade the
Q103: Suppose that in an election for