Essay
The following contingency table provides a joint frequency distribution for the popular votes cast in the 1984 presidential election by region and political party. Data are in thousands, rounded to the nearest thousand. 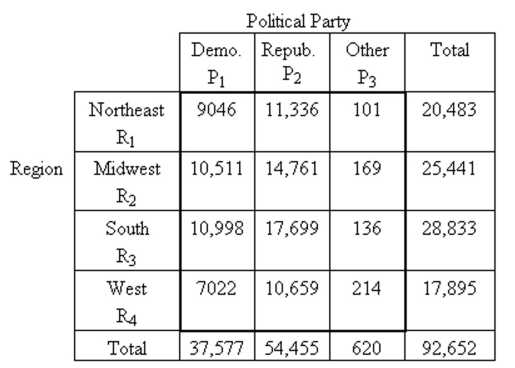 If a person who voted in the 1984 presidential election is selected at random, . Interpret this probability in terms of percentages.
Correct Answer:

Verified
11.3% of the people who voted ...View Answer
Unlock this answer now
Get Access to more Verified Answers free of charge
Correct Answer:
Verified
View Answer
Unlock this answer now
Get Access to more Verified Answers free of charge
Q43: Determine whether the events are independent.<br>-The
Q44: Find the conditional probability.<br>-If two fair dice
Q45: Use counting rules to determine the probability.<br>-A
Q46: Determine the number of outcomes that
Q47: Explain why an event and its complement
Q49: How many ways can 6 people be
Q50: A card is selected randomly from a
Q51: <span class="ql-formula" data-value="\text { Consider the following
Q52: List the outcome(s)of the stated event.<br>-The
Q53: Use the rule of total probability to