Essay
The following contingency table provides a joint frequency distribution for the popular votes cast in the presidential election by region and political party. Data are in thousands, rounded to the nearest thousand. 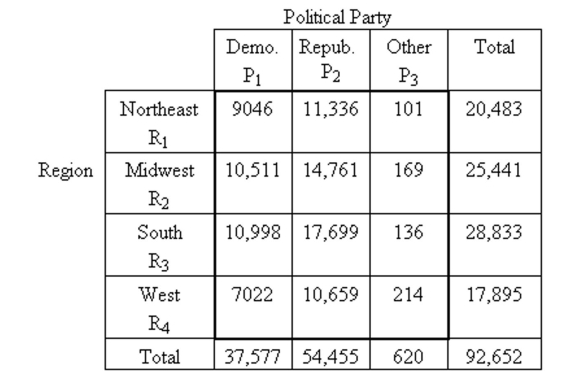 If a person who voted in the presidential election is selected at random, . Interpret this probability in terms of percentages.
Correct Answer:

Verified
For the people who voted in th...View Answer
Unlock this answer now
Get Access to more Verified Answers free of charge
Correct Answer:
Verified
View Answer
Unlock this answer now
Get Access to more Verified Answers free of charge
Q10: Find the indicated probability.<br>-In a batch of
Q11: Use the basic counting rule to solve
Q12: Find the conditional probability.<br>-The age distribution
Q13: Determine whether the events are independent.<br>-In a
Q14: Use the special multiplication rule to find
Q16: Find the indicated probability by using the
Q17: Determine whether the events are independent.<br>-When
Q18: Consider the following counting problem. How many
Q19: List the outcomes comprising the specified
Q20: Use the special multiplication rule to find