Multiple Choice
Construct and interpret a boxplot or a modified boxplot as specified.
-The test scores of 40 students are listed below. Construct a boxplot for the data.
A) 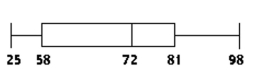
The data is left-skewed.
B) 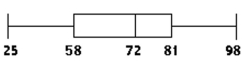
The data is slightly left-skewed.
C) 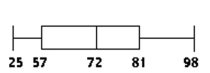
The data is fairly symmetrical.
D) 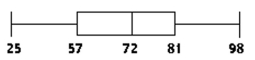
The data is slightly left-skewed.
Correct Answer:

Verified
Correct Answer:
Verified
Q6: <span class="ql-formula" data-value="\text { Explain what each
Q7: A teacher records the test scores for
Q8: Identify potential outliers, if any, for
Q9: Determine the quartile or interquartile range
Q10: Use the empirical rule to solve the
Q12: Discuss the differences between the distributions represented
Q13: Find the mode(s)for the given sample
Q14: Identify potential outliers, if any, for
Q15: Find the median for the given sample
Q52: Provide an appropriate response.<br>-We want to compare