Multiple Choice
Construct and interpret a boxplot or a modified boxplot as specified.
-The weights (in pounds) of 30 newborn babies are listed below. Construct a boxplot for the data.
A) 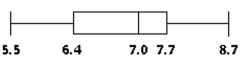
The data is left-skewed.
B) 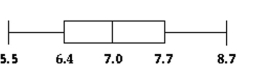
The data is highly symmetrical. It is a uniform distribution.
C) 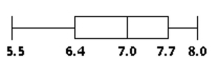
The data is slightly left-skewed.
D) 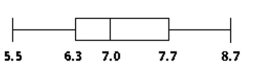
The data is slightly right-skewed.
Correct Answer:

Verified
Correct Answer:
Verified
Q88: Find the mode(s)for the given sample
Q89: Find the mean for the given sample
Q90: Use the empirical rule to solve
Q91: Find the median for the given sample
Q92: Find the median for the given
Q94: A teacher records the test scores for
Q95: Find the mode(s)for the given sample
Q96: Identify potential outliers, if any, for
Q97: Find the range for the given
Q98: Determine the quartile or interquartile range