Multiple Choice
Construct and interpret a boxplot or a modified boxplot as specified.
-The normal monthly precipitation (in inches) for August is listed for 20 different U.S. cities. Construct a boxplot for the data.
A) 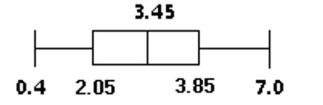
The data is symmetrical. It is a uniform distribution.
B) 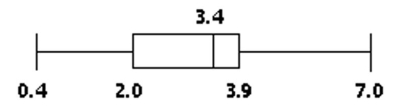
The data is slightly left-skewed.
C) 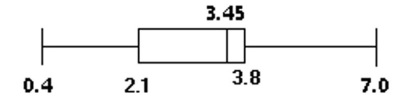
The data is slightly left-skewed.
D) 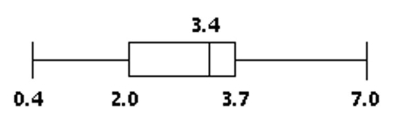
The data is highly left-skewed.
Correct Answer:

Verified
Correct Answer:
Verified
Q94: A teacher records the test scores for
Q95: Find the mode(s)for the given sample
Q96: Identify potential outliers, if any, for
Q97: Find the range for the given
Q98: Determine the quartile or interquartile range
Q100: Explain in your own words the difference
Q101: Identify potential outliers, if any, for
Q102: Solve the problem.<br>-Do men and women
Q103: Construct and interpret a boxplot or
Q104: A machine fills bottles with juice. The