Multiple Choice
Construct and interpret a boxplot or a modified boxplot as specified.
-The highest temperatures ever recorded (in °F) in 32 different U.S. states are shown below. Construct a boxplot for the data.
A) 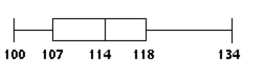
The data is slightly right-skewed.
B) 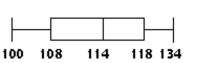
The data is fairly symmetrical.
C) 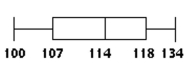
The data is fairly symmetrical.
D) 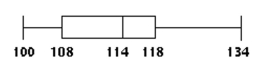
The data is slightly left-skewed.
Correct Answer:

Verified
Correct Answer:
Verified
Q27: Find the median for the given sample
Q28: A meteorological office keeps records of the
Q29: Find the sample standard deviation for
Q30: Provide an appropriate response.<br>-A company's raw-data
Q31: Find the sample standard deviation for the
Q33: Draw one boxplot to illustrate bell-shaped data,
Q34: Determine the quartile or interquartile range
Q35: Find the mean for the given
Q36: Determine the quartile or interquartile range
Q37: Use the empirical rule to solve the