Essay
The bar graph below shows the average cost of renting a studio in one city in each of the years 2002 through 2006. 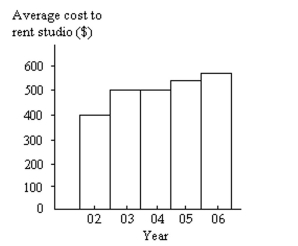 By what percentage does the average price increase from 2002 to 2003? Obtain a truncated version of the graph by sliding a piece of paper over the bottom of the graph so that the bars start at 300. In the truncated graph, by what percentage does the price appear to increase from 2002 to 2003? Why is the truncated graph misleading?
Correct Answer:

Verified
Answers will vary. Possible answer: The ...View Answer
Unlock this answer now
Get Access to more Verified Answers free of charge
Correct Answer:
Verified
View Answer
Unlock this answer now
Get Access to more Verified Answers free of charge
Q2: Provide an appropriate response.<br>-Suppose you are comparing
Q54: A graphical display of a data set
Q55: Classify the data as either discrete
Q56: Construct a stem-and-leaf diagram for the
Q57: Suppose that you wish to construct
Q59: Provide the requested response.<br>-The table contains
Q60: A nurse measured the blood pressure of
Q61: A graphical display of a data set
Q62: For the year 2006 , a
Q119: Explain in your own words the difference