Essay
The bar graph below shows the number of car accidents occurring in one city in each of the years 2001 through 2006. The number of accidents dropped in 2003 after a new speed limit was imposed. Why is the graph misleading? How would you redesign the graph to be less misleading? 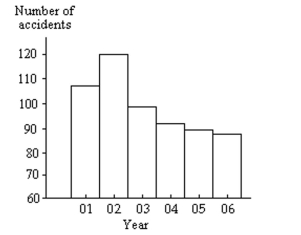
Correct Answer:

Verified
Answers will vary. Possible answer: The...View Answer
Unlock this answer now
Get Access to more Verified Answers free of charge
Correct Answer:
Verified
View Answer
Unlock this answer now
Get Access to more Verified Answers free of charge
Q73: A variable whose possible values are 1.15,
Q74: A high school teacher keeps a record
Q75: Classify the data as either qualitative
Q76: Shortly before an election, a market
Q77: The blood types for 40 people
Q79: Construct the requested histogram.<br>-The table gives
Q80: Scott Tarnowski owns a pet grooming
Q81: Construct a stem-and-leaf diagram for the
Q82: Construct a pie chart representing the
Q83: Identify the variable.<br>-The following table gives