Multiple Choice
A graphical display of a data set is given. State whether the distribution is (roughly) symmetric, right skewed, or leftskewed.
-Two dice were rolled and the sum of the two numbers was recorded. This procedure was repeated 400 times. The results are shown in the relative frequency histogram below. 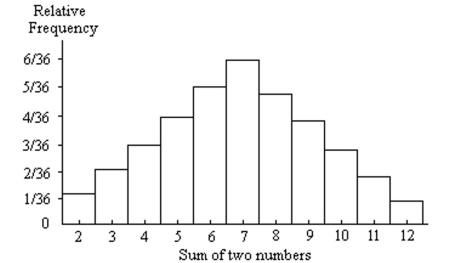
A) Left skewed
B) Symmetric
C) Right skewed
Correct Answer:

Verified
Correct Answer:
Verified
Q29: Construct the requested histogram.<br>-The table below
Q30: Complete the contingency table and use it
Q31: Complete the contingency table and use it
Q32: The following table shows the average
Q33: A large record company reported the
Q35: The data in the following table
Q36: The following table gives the top
Q37: Provide the requested response.<br>-The table contains
Q38: Which type of graph, a stem-and-leaf
Q39: A graphical display of a data set