Essay
Construct a residual plot for the given data.
-A grass seed company conducts a study to determine the relationship between the density of seeds planted (in pounds per 500 sq ft)and the quality of the resulting lawn. Eight similar plots of land are selected and each is planted with a particular density of seed. One month later the quality of each lawn is rated on a scale of 0 to 100. The sample data are given below, where x denotes seed density, and y denotes lawn quality. 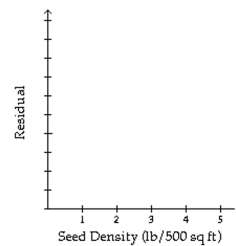
Correct Answer:

Verified
Correct Answer:
Verified
Q3: What would you expect for the linear
Q4: In the correlation test for normality, the
Q5: <span class="ql-formula" data-value="\text { In the context
Q6: The correlation test for normality involves computing
Q7: A researcher is interested in the relationship
Q9: Construct a normal probability plot of
Q10: Construct a normal probability plot of
Q11: In a study of the relationship between
Q12: The graph below is a residual plot
Q13: Paired sample data is given. Discuss