Essay
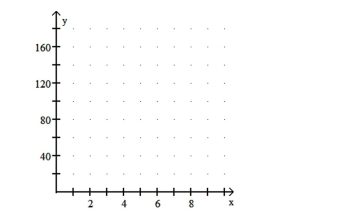
For a day's work, Chris is paid $50 to cover expenses plus $16 per hour. Let x denote the number of hours Chris works in a day and let y denote Chris's total salary for the day. Obtain the equation that expresses y in terms of x. Construct a table of values using the x-values 2, 4, and 8 hours. Draw the graph of the equation by plotting the points from the table and connecting them with a straight line. Use the graph to estimate visually Chris's salary for the day if he works 6 hours. 
Correct Answer:

Verified
y = 50 + 16x 
 Salary for t...
View Answer
Unlock this answer now
Get Access to more Verified Answers free of charge
Correct Answer:
Verified
View Answer
Unlock this answer now
Get Access to more Verified Answers free of charge
Q4: In the context of regression analysis, the
Q5: Determine the y-intercept and slope of the
Q6: Obtain the linear correlation coefficient for
Q7: A regression equation is obtained for
Q8: What is the relationship between the linear
Q10: A ball is thrown downward from a
Q11: Is the data point, P, an outlier,
Q12: The y-intercept and slope, respectively, of
Q13: For each of 200 randomly selected cities,
Q14: Explain why having a high linear correlation