Multiple Choice
Use the contingency table to solve the problem.
-The following contingency table shows the popular votes cast in the 1984 presidential election cross classified by region and political party. Data are in thousands, rounded to the nearest thousand. 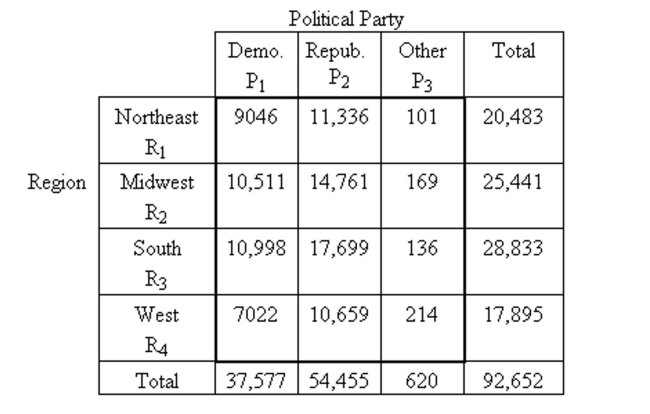 What percentage of the voters were in the Midwest?
A) 40.6%
B) 27.5%
C) 11.3%
D) 41.3%
Correct Answer:

Verified
Correct Answer:
Verified
Q27: A researcher records for each of 500
Q28: Find the value of the chi-square
Q29: Perform a chi-square independence test using
Q30: <span class="ql-formula" data-value="x ^ { 2 }"><span
Q31: Perform a chi-square independence test using
Q33: Perform a chi-square independence test using
Q34: Perform a chi-square independence test using the
Q35: What is a chi-square goodness-of-fit test used
Q36: Perform a chi-square independence test using the
Q37: What is the null hypothesis for the