Multiple Choice
Use the contingency table to solve the problem.
-The following contingency table shows the popular votes cast in the 1984 presidential election cross classified by region and political party. Data are in thousands, rounded to the nearest thousand. 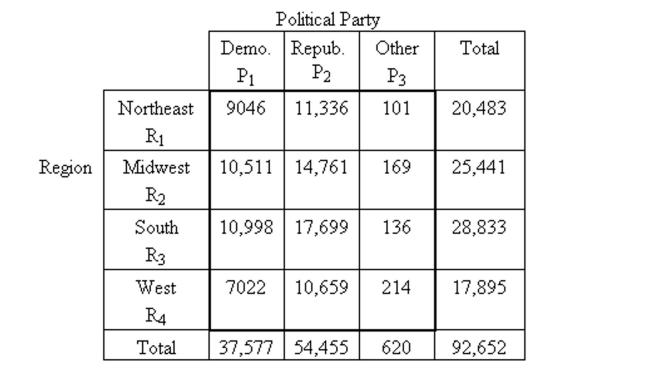 What percentage of those who voted Republican were in the South?
A) 58.8%
B) 61.4%
C) 32.5%
D) 19.1%
Correct Answer:

Verified
Correct Answer:
Verified
Q17: Suppose that you wish to perform a
Q18: Perform the indicated goodness-of-fit test. Be
Q19: Suppose that you wish to perform a
Q20: Perform a chi-square homogeneity test, provided
Q21: Explain the difference between univariate and bivariate
Q23: The table below shows the conditional distributions
Q24: Perform a chi-square independence test using the
Q25: Find the value of the chi-square
Q26: Perform the indicated goodness-of-fit test using
Q27: A researcher records for each of 500