Multiple Choice
Look at the utility function graphed below and select the type of decision maker that corresponds to
The graph.
A) Risk averter
B) Risk neutral
C) Risk taker
D) Risk player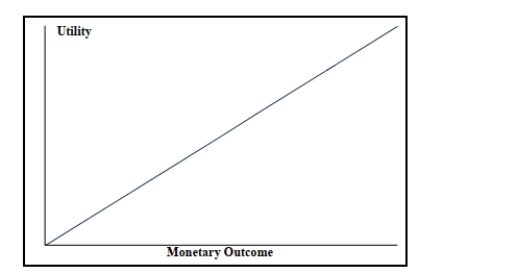
Correct Answer:

Verified
Correct Answer:
Verified
Related Questions
Q57: SCENARIO 20-5<br>The following payoff table shows profits
Q86: SCENARIO 20-6<br>A student wanted to find out
Q98: SCENARIO 20-6<br>A student wanted to find out
Q110: SCENARIO 20-6<br>A student wanted to find out
Q111: SCENARIO 20-6<br>A student wanted to find out
Q112: SCENARIO 20-1<br>The following payoff table shows profits
Q117: SCENARIO 20-4<br>A stock portfolio has the following
Q119: SCENARIO 20-6<br>A student wanted to find out
Q120: The difference between expected payoff under certainty
Q121: For a potential investment of $5,000,a portfolio