Multiple Choice
SCENARIO 19-3 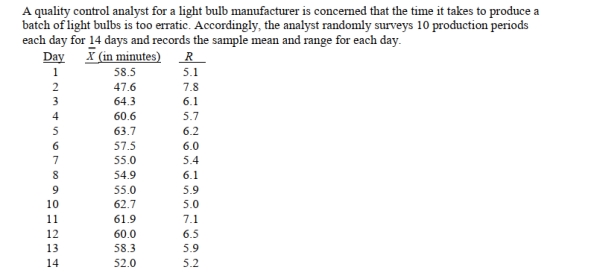
-Referring to Scenario 19-3, suppose the analyst constructs an R chart to see if the variability in
Production times is in-control.The R chart is characterized by which of the following?
A) Increasing trend
B) Decreasing trend
C) In-control
D) Points outside the control limits
Correct Answer:

Verified
Correct Answer:
Verified
Q1: True or False: Referring to Scenario 19-8,
Q4: True or False: In the United States,
Q5: True or False: Poke-Yoke devices is among
Q6: True or False: The p chart is
Q7: Which of the following situations suggests a
Q8: <img src="https://d2lvgg3v3hfg70.cloudfront.net/TB2675/.jpg" alt=" " class="answers-bank-image d-block" rel="preload"
Q9: True or False: One of the morals
Q10: True or False: The SS method establishes
Q11: True or False: Common causes of variation
Q92: One of the morals of the red