Multiple Choice
SCENARIO 19-4 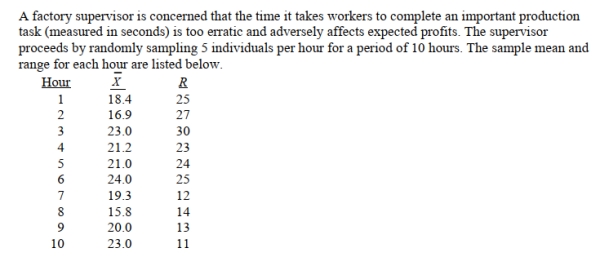 She also decides that lower and upper specification limit for the critical-to-quality variable should be
10 and 30 seconds, respectively.
-Referring to Scenario 19-4, suppose the sample mean and range data were based on 6
Observations per hour instead of 5.How would this change affect the lower and upper control
Limits of an R chart?
A) LCL would increase; UCL would decrease.
B) LCL would remain the same; UCL would decrease.
C) Both LCL and UCL would remain the same.
D) LCL would decrease; UCL would increase.
Correct Answer:

Verified
Correct Answer:
Verified
Q12: Determining the root causes of why defects
Q16: True or False: It is not possible
Q19: SCENARIO 19-3 <img src="https://d2lvgg3v3hfg70.cloudfront.net/TB2675/.jpg" alt="SCENARIO 19-3
Q20: True or False: Total Production Maintenance is
Q23: True or False: Total Productive Maintenance focuses
Q24: True or False: The SS method establishes
Q25: True or False: A process capability is
Q26: The principal focus of the control chart
Q27: A process is said to be out
Q42: Variation signaled by individual fluctuations or patterns