True/False
SCENARIO 17-3
The tree diagram below shows the results of the classification tree model that has been constructed to
predict the probability of a cable company's customers who will switch ("Yes" or "No")into its
bundled program offering based on the price ($30, $40, $50, $60)and whether the customer spends
more than 5 hours a day watching TV ("Yes" or "No")using the data set of 100 customers collected
from a survey. 
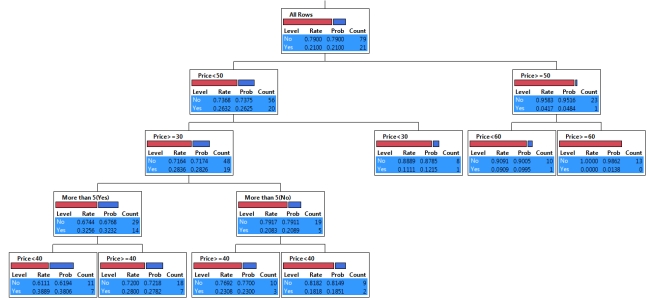
-True or False: Referring to Scenario 17-3, the highest probability of switching is predicted to
occur among customers who do not watch more than 5 hours of TV a day and are offered the
bundled price of lower than $50.
Correct Answer:

Verified
Correct Answer:
Verified
Q17: Which of the following finds relationships in
Q36: SCENARIO 17-7<br>The output below shows the results
Q37: SCENARIO 17-4<br>The regression tree below was obtained
Q39: True or False: In multidimensional scaling, the
Q40: SCENARIO 17-4<br>The regression tree below was obtained
Q42: True or False: Single linkage can be
Q43: True or False: The forward-and-backward computation among
Q44: True or False: You can compute any
Q45: True or False: In a regression tree,
Q46: True or False: In metric multidimensional scaling,