Multiple Choice
SCENARIO 2-4
A survey was conducted to determine how people rated the quality of programming available on
television.Respondents were asked to rate the overall quality from 0 (no quality at all) to 100
(extremely good quality) .The stem-and-leaf display of the data is shown below. 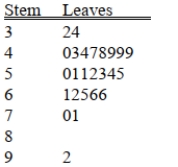
-Referring to Scenario 2-4, what percentage of the respondents rated overall television quality
With a rating from 50 through 75?
A) 11
B) 40
C) 44
D) 56
Correct Answer:

Verified
Correct Answer:
Verified
Q36: SCENARIO 2-14 <br>The table below contains the
Q91: SCENARIO 2-7<br>The Stem-and-Leaf display below contains data
Q124: True or False: One of the advantages
Q125: SCENARIO 2-18<br>The stem-and-leaf display below shows the
Q126: True or False: The relative frequency is
Q128: You have collected data on the responses
Q129: The width of each class grouping or
Q130: True or False: In general, grouped frequency
Q132: True or False: Histograms are used for
Q133: SCENARIO 2-5<br>The following are the duration in