Multiple Choice
SCENARIO 2-16
The figure below is the percentage polygon for the amount of calories for a sample of 36 pizzas
products where the upper limits of the intervals are: 310, 340, 370, 400 and 430.
Percentage Polygon for Calories 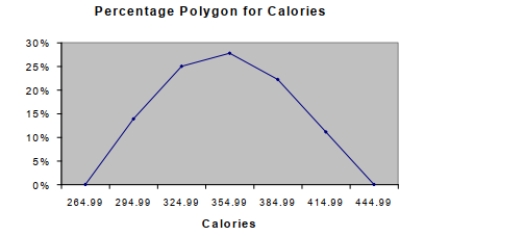
-Referring to Scenario 2C-16alo, rriouges hly what percentage of pizza products contains between 400
And 430 calories?
A) 0%
B) 11%
C) 89%
D) 100%
Correct Answer:

Verified
Correct Answer:
Verified
Q91: SCENARIO 2-5<br>The following are the duration in
Q92: SCENARIO 2-12<br>The table below contains the opinions
Q93: True or False: In graphing two categorical
Q94: True or False: In general, a frequency
Q95: SCENARIO 2-14 <br>The table below contains the
Q96: You have collected data on the approximate
Q97: True or False: A histogram can have
Q99: True or False: Apple Computer, Inc.collected information
Q100: True or False: The Guidelines for Developing
Q179: SCENARIO 2-7<br>The Stem-and-Leaf display below contains data