True/False
SCENARIO 2-18
The stem-and-leaf display below shows the result of a survey on 50 students on their satisfaction
with their school with the higher scores represent higher level of satisfaction. 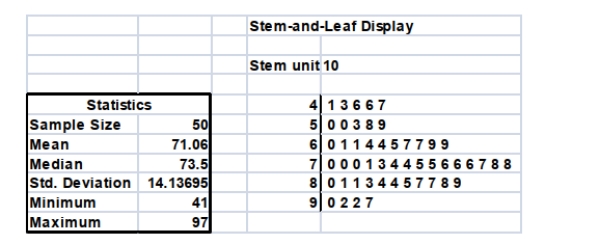
-True or False: Referring to Scenario 2-18, if a student is randomly selected, his/her most likely
level of satisfaction will be in the 60s among the 40s, 50s, 60s, 70s, 80s and 90s.
Correct Answer:

Verified
Correct Answer:
Verified
Q50: SCENARIO 2-14 <br>The table below contains the
Q68: SCENARIO 2-7<br>The Stem-and-Leaf display below contains data
Q112: SCENARIO 2-12<br>The table below contains the opinions
Q113: True or False: A side-by-side bar chart
Q115: True or False: Percentage polygons are plotted
Q119: True or False: The Guidelines for Developing
Q119: SCENARIO 2-11<br>The ordered array below resulted from
Q121: True or False: The percentage distribution cannot
Q122: Data on 1,500 students' height were collected
Q170: SCENARIO 2-14 <br>The table below contains the