True/False
True or False: Given below is the scatter plot of the price/earnings ratio versus earnings per
share of 20 U.S.companies.There appears to be a negative relationship between price/earnings
ratio and earnings per share. 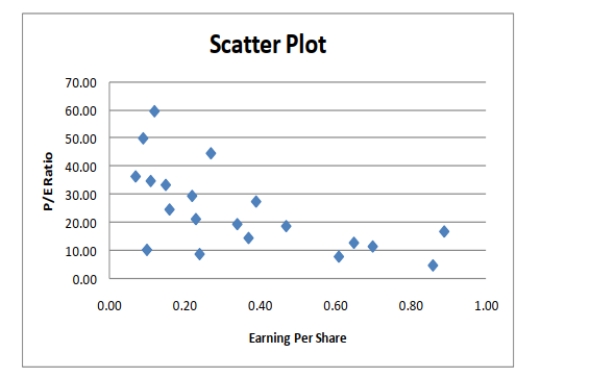
Correct Answer:

Verified
Correct Answer:
Verified
Q8: SCENARIO 2-9<br>The frequency distribution below represents the
Q25: It is essential that each class grouping
Q47: The point halfway between the boundaries of
Q58: SCENARIO 2-3<br>Every spring semester, the School of
Q59: SCENARIO 2-12<br>The table below contains the opinions
Q61: A survey of 150 executives were asked
Q66: True or False: A research analyst was
Q70: You have collected data on the monthly
Q108: SCENARIO 2-18<br>The stem-and-leaf display below shows the
Q177: SCENARIO 2-14 <br>The table below contains the