True/False
True or False: Given below is the scatter plot of the market value (thousands$)and profit
(thousands$)of 50 U.S.companies.Higher market values appear to be associated with higher
profits. 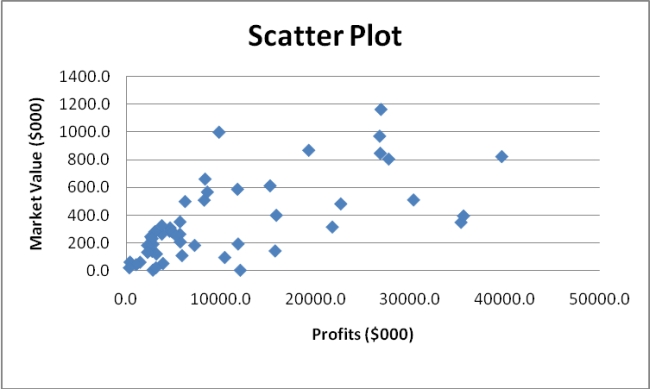
Correct Answer:

Verified
Correct Answer:
Verified
Related Questions
Q19: In a contingency table,the number of rows
Q39: SCENARIO 2-12<br>The table below contains the opinions
Q41: SCENARIO 2-15<br>The figure below is the ogive
Q42: SCENARIO 2-6<br>A sample of 200 students at
Q43: You have collected information on the market
Q48: SCENARIO 2-12<br>The table below contains the opinions
Q87: SCENARIO 2-14 <br>The table below contains the
Q93: A_ is a vertical bar chart in
Q106: SCENARIO 2-11<br>The ordered array below resulted from
Q161: SCENARIO 2-14 <br>The table below contains the