True/False
True or False: Given below is the scatter plot of the market value (thousands$)and profit
(thousands$)of 50 U.S.companies.There appears to be a negative relationship between market
value and profit. 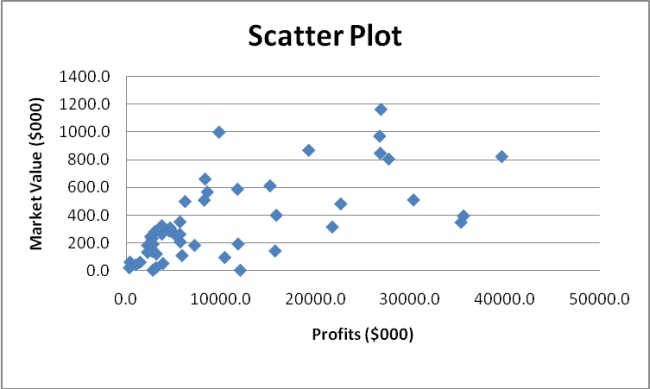
Correct Answer:

Verified
Correct Answer:
Verified
Q104: When constructing charts,the following is plotted at
Q105: True or False: When constructing a frequency
Q108: You have collected data on the number
Q111: True or False: The stem-and-leaf display is
Q112: SCENARIO 2-12<br>The table below contains the opinions
Q113: True or False: A side-by-side bar chart
Q156: SCENARIO 2-18<br>The stem-and-leaf display below shows the
Q163: SCENARIO 2-11<br>The ordered array below resulted from
Q170: SCENARIO 2-14 <br>The table below contains the
Q184: SCENARIO 2-9<br>The frequency distribution below represents the