True/False
True or False: Given below is the scatter plot of the number of employees and the total revenue
($millions)of 20 U.S.companies.There appears to be a positive relationship between total
revenue and the number of employees. 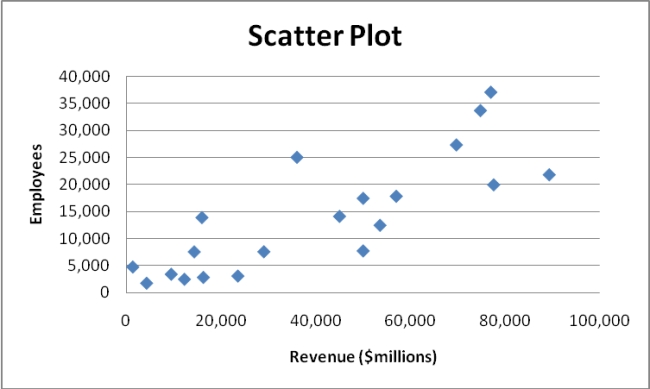
Correct Answer:

Verified
Correct Answer:
Verified
Q10: SCENARIO 2-12<br>The table below contains the opinions
Q12: True or False: The percentage polygon is
Q17: True or False: A Walmart store in
Q18: SCENARIO 2-5<br>The following are the duration in
Q19: SCENARIO 2-12<br>The table below contains the opinions
Q32: SCENARIO 2-8<br>The Stem-and-Leaf display represents the number
Q73: SCENARIO 2-5<br>The following are the duration in
Q75: SCENARIO 2-8<br>The Stem-and-Leaf display represents the number
Q131: SCENARIO 2-10<br>The histogram below represents scores achieved
Q159: SCENARIO 2-11<br>The ordered array below resulted from