True/False
True or False: Given below is the scatter plot of the number of employees and the total revenue
($millions)of 20 U.S.companies.Companies that have higher numbers of employees appear to
also have higher total revenue. 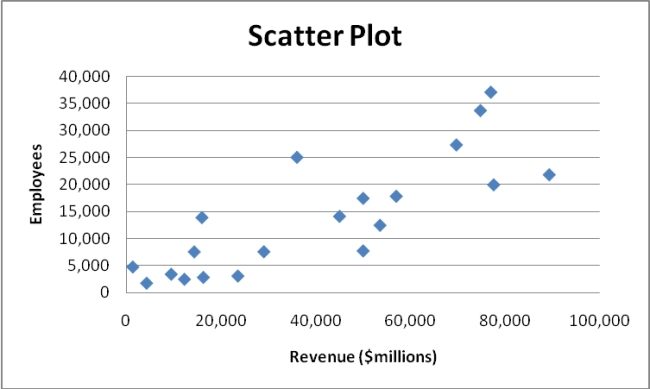
Correct Answer:

Verified
Correct Answer:
Verified
Q3: SCENARIO 2-17<br>The following table presents total retail
Q4: True or False: The Guidelines for Developing
Q5: SCENARIO 2-15<br>The figure below is the ogive
Q10: SCENARIO 2-12<br>The table below contains the opinions
Q12: True or False: The percentage polygon is
Q32: SCENARIO 2-8<br>The Stem-and-Leaf display represents the number
Q44: SCENARIO 2-17<br>The following table presents total retail
Q54: SCENARIO 2-2<br>2-2 Organizing and Visualizing Variables<br>At a
Q133: SCENARIO 2-18<br>The stem-and-leaf display below shows the
Q159: SCENARIO 2-11<br>The ordered array below resulted from